OutputSurface
This class only modifies the output of OutputWriters. If there are 3D meshes present, it creates a 2D mesh on the surface of the 3D mesh and outputs only the 2D data. This helps to reduce the output data size, usually what happens on the surface is the only interesting thing. Especially for problems with larger mesh sizes, the 3D mesh is often not practicable to store and visualize. Here, the 2D meshes can help.
C++ code:
OutputWriter::OutputSurface<
  // nested solver
>
Output of surface meshes
Python settings:
"OutputSurface": {
  "OutputWriter": [
    # output writer, e.g.:
    {"format": "Paraview", "outputInterval": (int)(1./dt_1D*output_timestep), "filename": "out/surface", "binary": True, "fixedFormat": False, "combineFiles": True},
  ],
  "face": ["1-"],

  # settings of the nested solver
}
OutputWriter
The output writers that will output the 2D mesh only, not the 3D mesh.
face
The 2D faces of the 3D volume which will be extracted. This has to be a list of faces, even if only a single face is required (then it is a list with one entry).
Possible values are 0-, 0+, 1-, 1+, 2-, 2+. faces shows the meaning for 1D, 2D and 3D meshes. In this case the 3D visualization (right picture) is relevant.o

Note
If the code runs in parallel and composite meshes are used, only the last sub mesh of the composite mesh is considered. Then each subdomain of that submesh has to span all us The reason is that each created 2D surface mesh has to take part in the collective communication functions of MPI. This is not the case if some surface meshes only need a subset of the MPI ranks of the other surface meshes.
If unsure, try out the code. If errors or a crash occurs, then don’t use OutputSurface in this context.
(This is the reason why the static_biceps_emg example only works in parallel either with only one face or with two faces but only with partitioning in z direction.)
Surface Sampling
The surface output writer is also capable of sampling the resulting surface data at given positions. This is needed for EMG sampling at electrodes on the skin surface. The result can be written to a vtp file to be viewed in ParaView and to a CSV file for further processing.
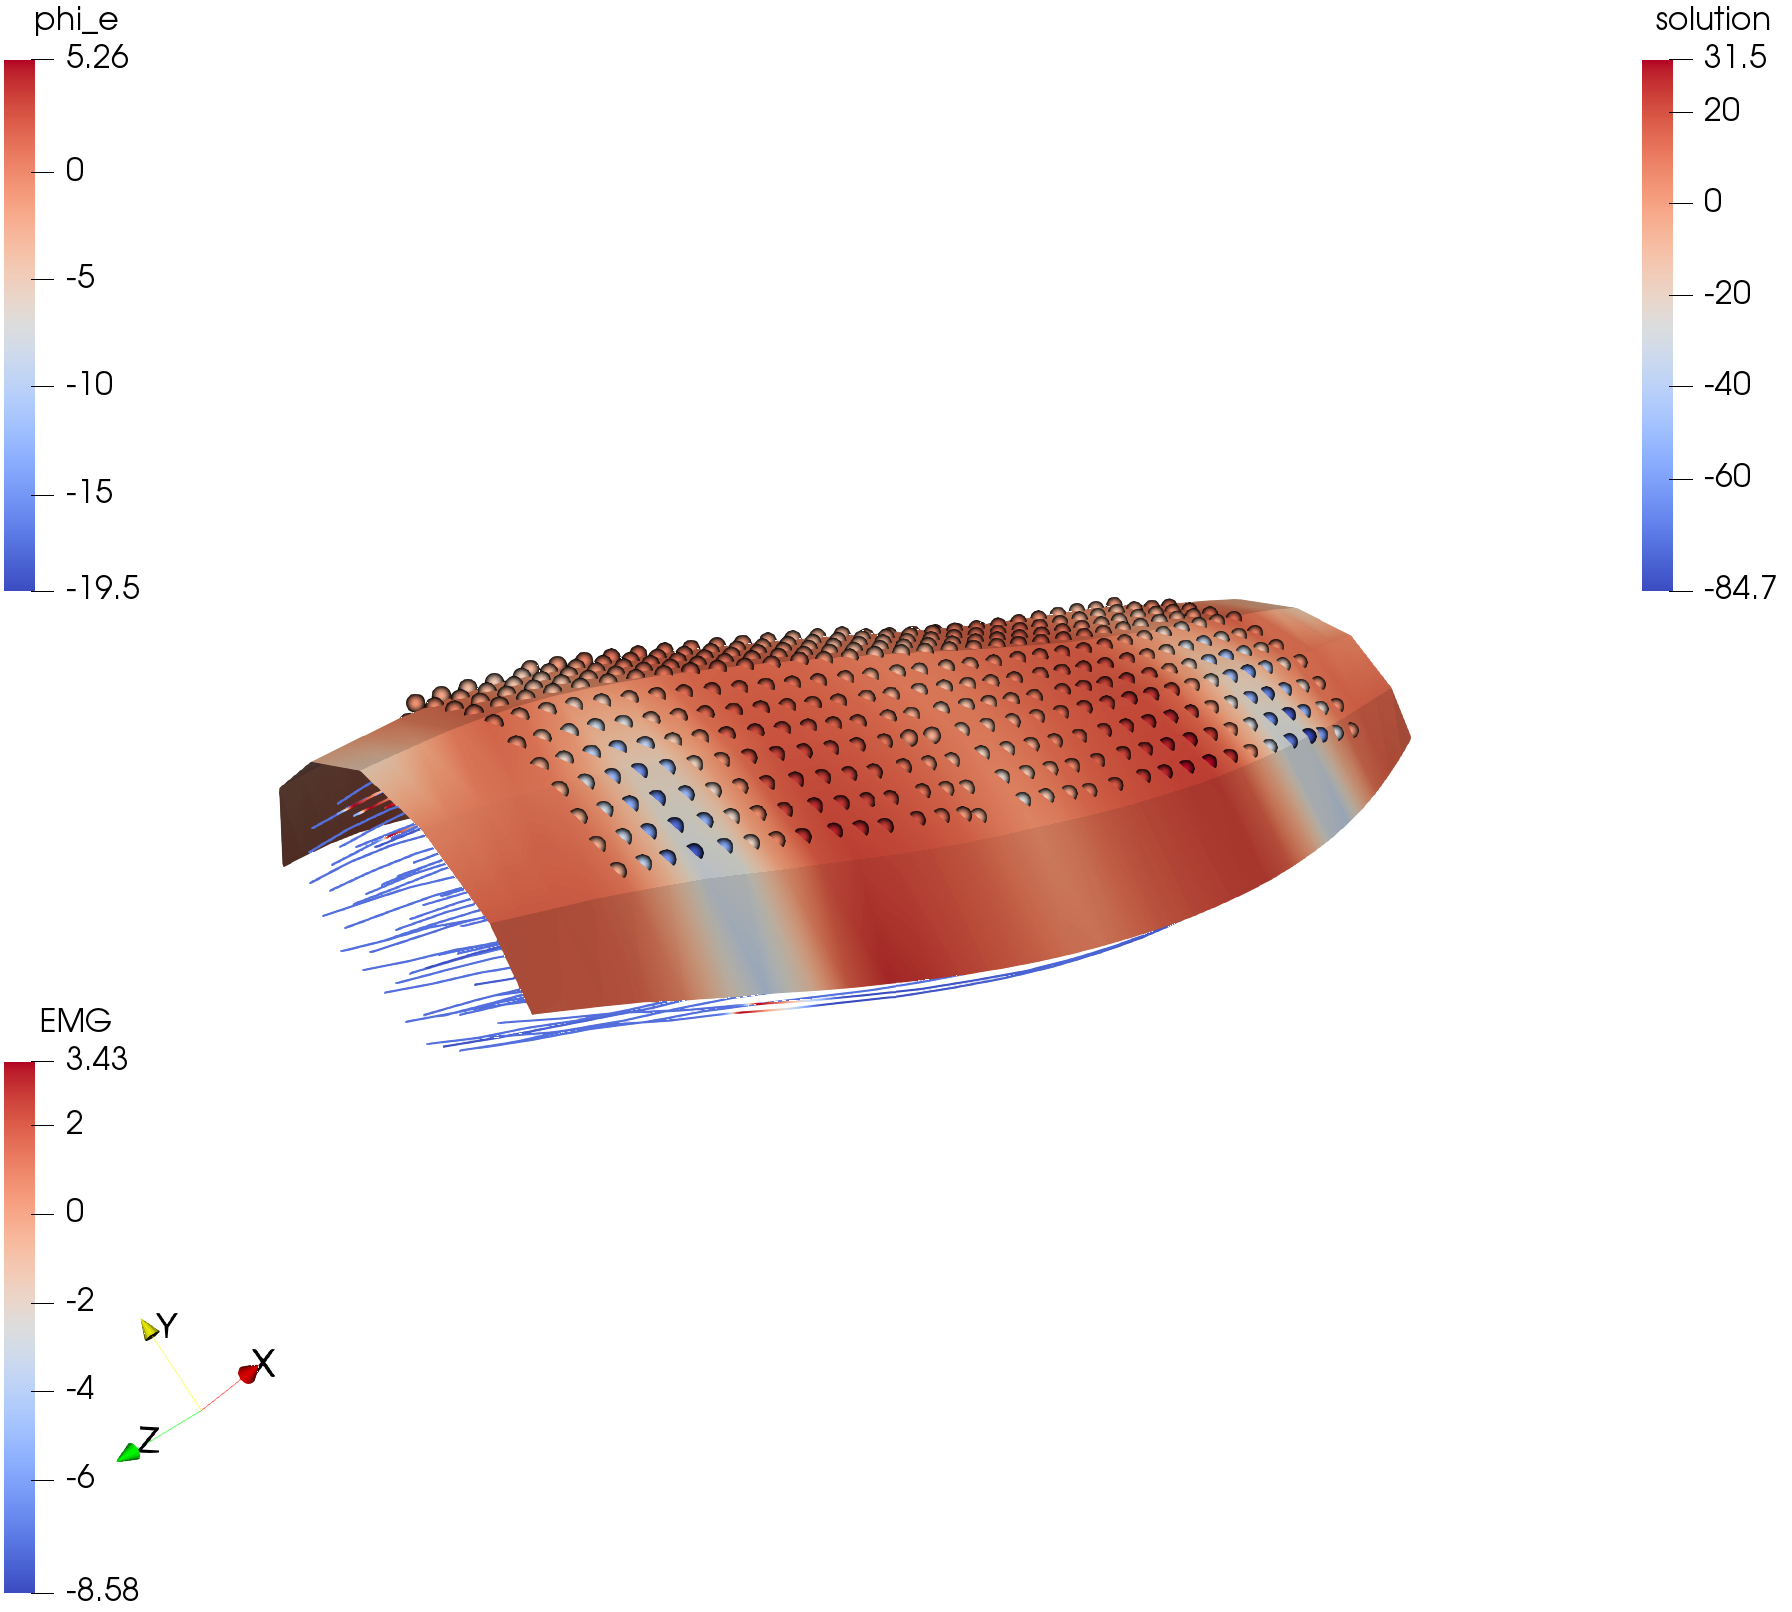
Fig. 110 This image shows a simulation from fibers_fat_emg. The surface mesh generated by the OutputSurface class, as well as the points of the electrodes are shown.
Python settings:
"OutputSurface": {
  "OutputWriter": [
    {"format": "Paraview", "outputInterval": int(1./variables.dt_3D*variables.output_timestep_surface), "filename": "out/" + variables.scenario_name + "/surface_emg", "binary": True, "fixedFormat": False, "combineFiles": True, "fileNumbering": "incremental"},
  ],
  #"face":                    ["1+","0+"],         # which faces of the 3D mesh should be written into the 2D mesh
  "face":                     ["1+"],              # which faces of the 3D mesh should be written into the 2D mesh
  "samplingPoints":           variables.hdemg_electrode_positions,    # the electrode positions, they are created in the helper.py script
  "updatePointPositions":     False,               # the electrode points should be initialize in every timestep (set to False for the static case). This makes a difference if the muscle contracts, then True=fixed electrodes, False=electrodes moving with muscle.
  "filename":                 "out/{}/electrodes.csv".format(variables.scenario_name),
  "enableCsvFile":            True,                # if the values at the sampling points should be written to csv files
  "enableVtpFile":            False,               # if the values at the sampling points should be written to vtp files
  "enableGeometryInCsvFile":  False,               # if the csv output file should contain geometry of the electrodes in every time step. This increases the file size and only makes sense if the geometry changed throughout time, i.e. when computing with contraction
  "xiTolerance":              0.3,                 # tolerance for element-local coordinates xi, for finding electrode positions inside the elements. Increase or decrease this numbers if not all electrode points are found.

  # settings of the nested solver
}
enableGeometryInCsvFile
Depending on the settings "enableGeometryInCsvFile", there are two possible file formats of the csv file:
If
"enableGeometryInCsvFile": True, the geometry information about the electrode positions is contained for every timestep. This increases the file size but allows to track moving electrodes (e.g. because of contraction). The csv file starts with the following lines:#timestamp;t;n_points;p0_x;p0_y;p0_z;p1_x;p1_y;p1_z;p2_x; (...) p171_z;p0_value;p1_value; (...) 2020/9/28 09:16:40;0;172;9.01393;15.7361;-54.7243; (...)
if
"enableGeometryInCsvFile": False, the geometry information about the electrode positions is not contained for every timestep. Instead it is contained once as a comment at the beginning in the second line. This produces a smaller file. The csv file starts with the following lines:#electrode positions (x0,y0,z0,x1,y1,z1,...); #; ;9.92639;13.9759;-54.8722; (...) #timestamp;t;n_points;p0_value;p1_value; (...) 2020/9/29 10:08:48;0;384;0.0030616;0.00300943; (...)
The script under $OPENDIHU_HOME/examples/electrophysiology/fibers/fibers_fat_emg/plot_emg.py can be used to plot the file contents and create an animation.